Viewing your embed stats

Soundslice includes a lightweight analytics system that shows you information about traffic to your embeds, including your monthly unique user counts.
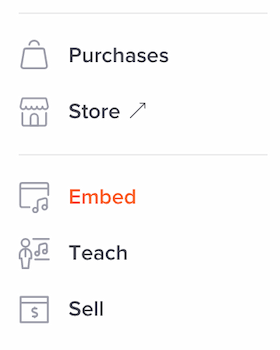
To access your stats, go to your Soundslice homepage and click “Embed” in the left sidebar:

Note: This link will only be visible if your Soundslice account is in the Licensing plan.
Stats overview
The stats page is split into several sections:
- At the top, you’ll see the total unique users and hits in the given month.
- Next, you’ll see a bar chart of unique users per day.
- Next, you’ll see a table with the number of unique users and hits per day.
- Finally, you’ll see a table with your top embedded slices, ranked by number of hits.
Unique users vs. hits
What’s the difference between a unique user and a hit?
- A hit is logged any time our embed is loaded on your site.
- A unique user is a single user of your site, as explained here.
You’ll probably find your number of hits is larger than your number of unique users. This is because a single unique user will likely view multiple Soundslice embeds in your website in a given month.
We charge based on number of unique users, not hits, but we include the hit counts so you can get a better sense of how much Soundslice is being used in your site.
Frequency of updates
At the moment, we update the embed stats every 24 hours, around midnight Chicago time.
Monthly archives
When you click the “Embed” link in your sidebar, you’ll be taken to the most recent month that has available stats — which is usually the current month.
To see stats for previous months, click “All stats” in the sidebar:

This will take you to a page where you can choose a month. Archives go back to April 2022.
Access to stats
If you have an organization account, you can control which of your organization members can access your embed stats. Use the “User can view traffic stats” checkbox when editing your organization members.